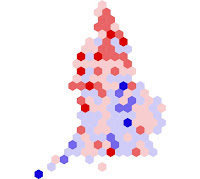
 Whilst the outcomes of the May Election may stem expenditure on consultancy, they did at least introduce us to other approaches in maps and visualisation. The BBC proportional map was based on hexagons representing each constituency and certainly provided an alternate view of the UK.
So I started to think about how cartograms can be used in my own line of work, and set about generating my own proportional map. I had actually written a MapBasic script 5 years ago, and used this to generate a hexagon outline across the UK. The script controls for hexagon size and grid dimensions, and with a bit of tweaking I approximated the 400 objects that I needed to cover England. Then I needed to relate each authority in England to a single hexagon.
The problem I had then was to convert from the actual boundary file to single hexagons. I could use a centroid approach, but either way I would need to remove hexagons. Instead I downloaded the cartogram application, ScapeToad, a nifty little programme that imports and exports ESRI shapefiles. By applying a standard weight across the England authorities, ScapeToad used the Gastner/Newman diffusion-based algorithm to distort the authorities. Essentially distorting the authority boundaries so that their centroids are evenly spaced. By exporting the resulting cartogram and then overlaying it with the hexagons I could run a spatial overlay to identify the hexagon associations. Then it was a case of moving the hexagon identifiers in turn so that there were no gaps. Once that manual process was completed the basis for the hexagon map is created.
What is the benefit? Well in many analyses the dominance of large rural locations can overpower detail within urban areas, and if an image is to be used at less than A4 scale this detail will be lost. In the example shown the same breakpoints are used, but even at the small image size used, the hexagon map quickly draws attention to details not immediately visible in the true spatial image.
Next time you need a map, consider a hexagon based approach, or the cartogram.

No comments:
Post a Comment